In facilitating teams of teachers who are focused on using their data to figure out next steps for instruction (or school level teams focused on teaching and learning), Using Data facilitators introduce processes and protocols to support genuine inquiry. There are the 5 phases of continuous improvement (or the 6 or the 8). And frequently schools implement cycles of improvement. What they so frequently miss is one element that makes it work. In music, it’s “all about the bass”.
In data analysis it’s all about discovery, being open, being in exploration mode, which means leavi ng assumptions at the door. The tension here is that as humans, we aren’t that comfortable with holding out in uncertainty. We want to solve problems quickly. We want to feel confident that we know what we’re doing. And any suggestions to the contrary, render us incapable to doing anything but sticking to what is familiar instead of taking the risks that high performing schools have come to relish.
If we extend the notion of being open a little further, it isn’t too far a stretch to realize that along with discovery and exploration goes one of the 7 Norms of Collaboration – 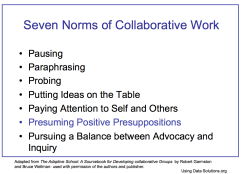 “Presuming Positive Presuppositions”. In other words, assume that everyone at the table only wants what’s best for our students. And most importantly, when looking at our students’ results, presume that every student wants to learn and to be successful. If we can presume positive presuppositions about them while we stay in discovery mode to learn more about their strengths, their sometimes hidden or buried aspirations, we can figure out how to design instruction that overwhelms the effects of poverty, learning disabilities and language differences.
In other words, explorers don’t let students’ historical and demographic profiles bias their instruction. Instead they are continuously open to the possibilities that are within every student we teach. Teacher teams who have learned how to confront their low expectations for student learning use the data to surface the questions leading to the next great discovery rather than jumping to premature conclusions that typically result in same old, same old – cycles of reteaching, assigned interventions and test prep.
On another note, with this week’s announcement by President-Elect, Donald Trump that his nomination for the Secretary of Education position is Betsy DeVos, a strong advocate of education vouchers and charter schools in Michigan, perhaps we could slow down any rush to judgement and instead, benefit by using some of the same processes for using data effectively (be in discovery mode, triangulate the data, search for root causes, monitor progress toward goals) before we draw conclusions about the implications of this appointment.


